 1 month ago
30
1 month ago
30
The countries with the cleanest air in the world have been ranked in a new report. We take a look at the results
The Caribbean island nation of the Bahamas has the world’s cleanest air, according to the latest World Air Quality Report from IQAir. The report ranks 138 countries and territories by the level of fine particulate matter present in the air.
Air pollution continues to pose one of the biggest threats to human health, causing the death of up to 8.1 million people every year. Billions more suffer the effects of poor air quality, which can lead to asthma and lung disease.
In 2019, the World Health Organisation (WHO) estimated that 99% of the world’s population was living in places where the WHO air quality guidelines levels were not met.
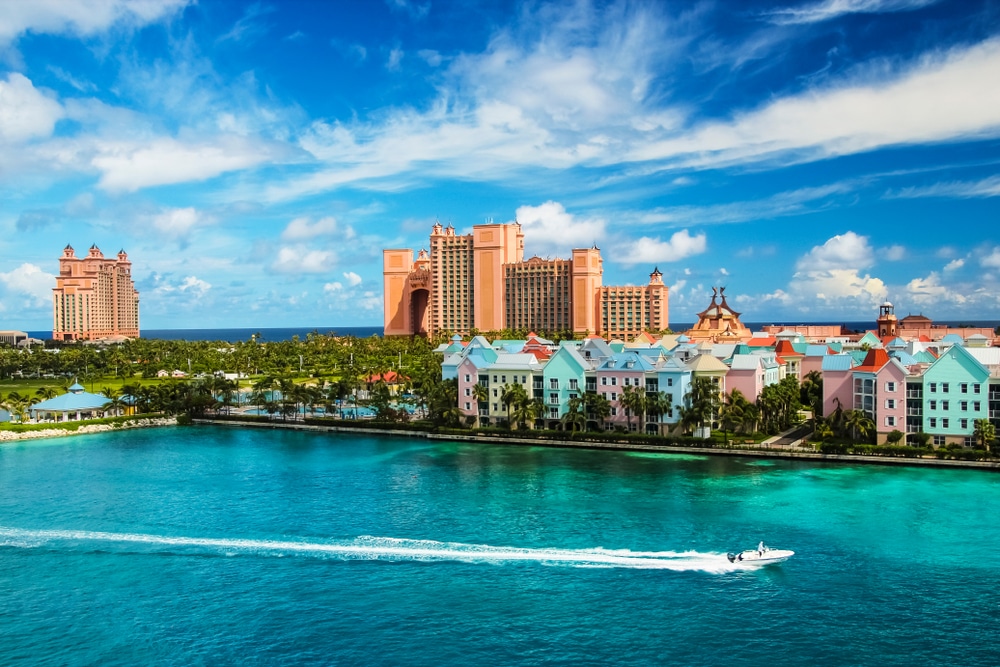 Stefan Ugljevarevic/Shutterstock The Bahamas have the cleanest air in the world
The latest report from IQAir draws on data from 40,000 air quality monitoring stations spread around 8,954 cities in 138 countries,
regions, and territories.
The Bahamas, made up of over 3,000 islands, cays and islets in the Caribbean Sea, have the cleanest air in the world, followed by the island nations of Bermuda, French Polynesia, US Virgin Islands and Puerto Rico.
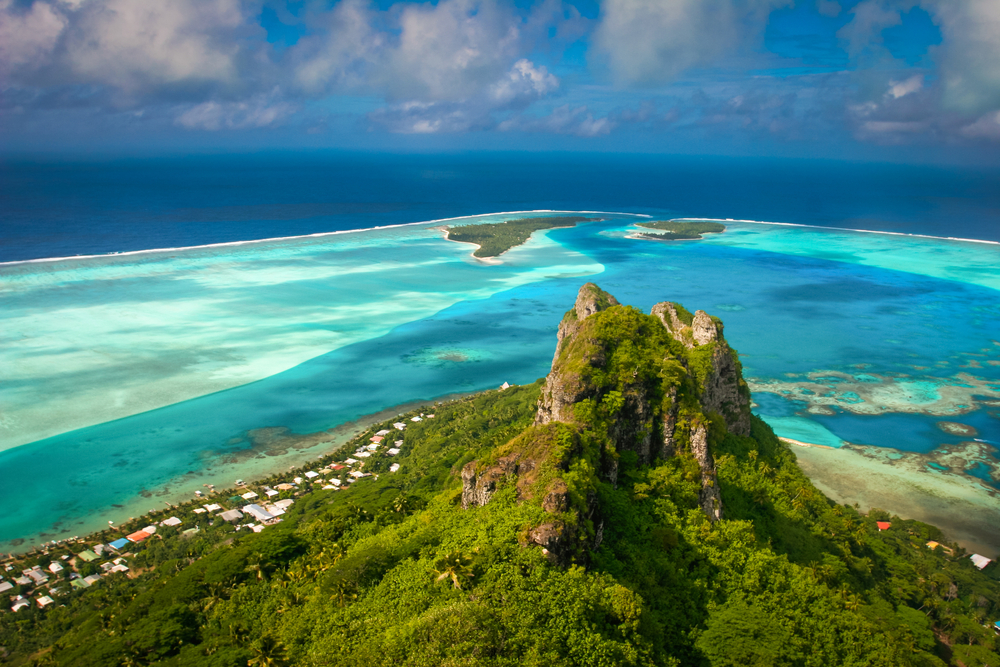 Piotr Gatlik/Shutterstock French Polynesia – like many island nations – performs well
Of 138 countries and territories surveyed in the report, just 12 countries or territories – the Bahamas, Bermuda, French Polynesia, US Virgin Islands, Puerto Rico, Montserrat, Barbados, Grenada, Iceland, New Zealand, Australia and Estonia – are meeting a World Health Organization (WHO) guideline limit for tiny airborne particles expelled by cars, trucks and industrial processes.
At the other end of the spectrum, Chad has the worst air quality, followed by Bangladesh, Pakistan, DR Congo and India.
Air Quality Index
The report analyses results from over 30,000 monitoring stations across the globe, making it the world’s largest centralised platform for measuring air quality.
It also draws on data collected from thousands of clean air initiatives administered by governments, non-profit organisations, citizens, communities and private companies.
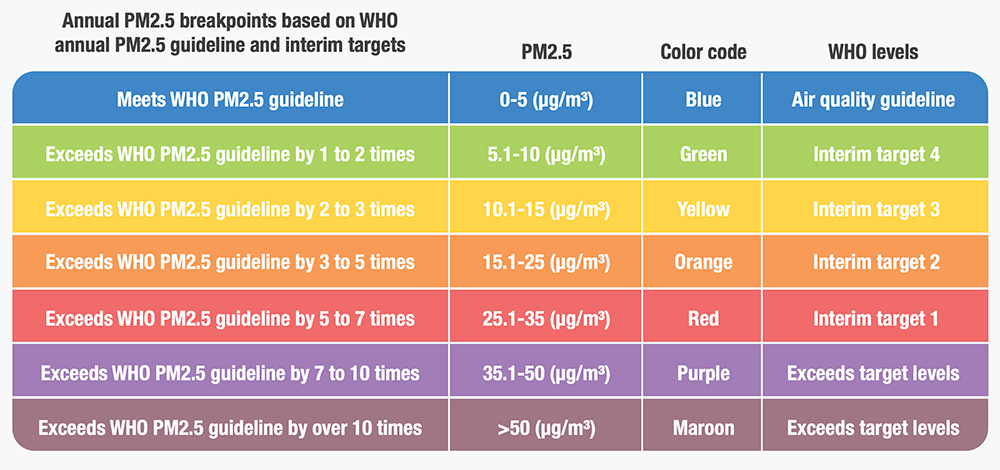 IQAir The World Air Quality Report’s visualisation framework
The report focuses on PM2.5 concentrations (μg/m³) as this pollutant is widely regarded as most harmful to human health. PM2.5 is defined as ambient airborne particles measuring up to 2.5 microns in size. A micron (or micrometre) is one-millionth of a metre or one-thousandth of a millimetre.
Its microscopic size allows the particles to enter the bloodstream via the respiratory system and travel through the body, causing a range of health problems, including asthma, lung cancer and heart disease.
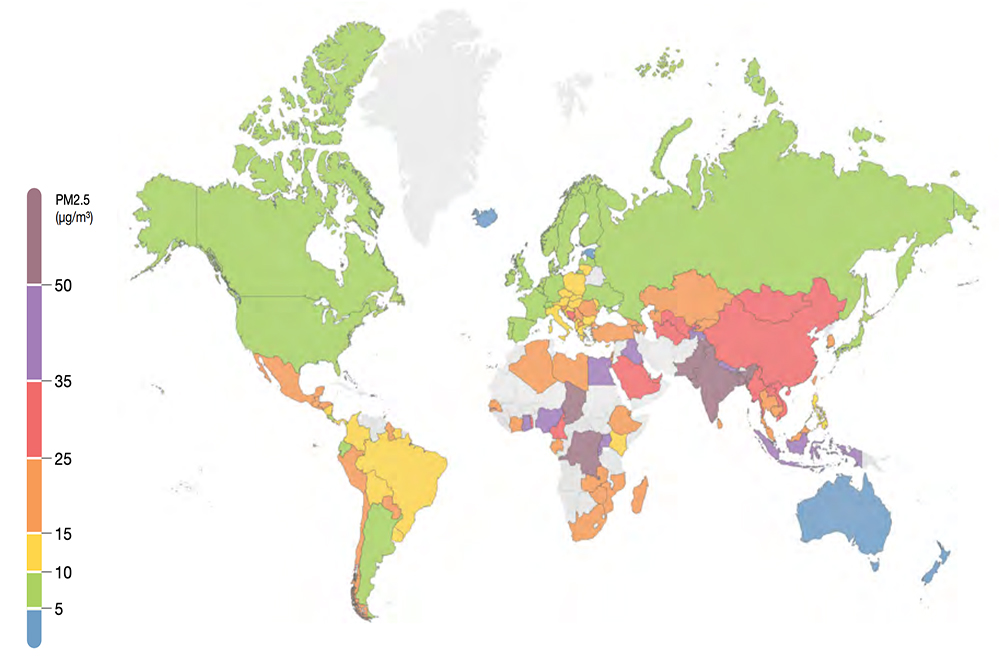 IQAir The countries in blue are the only ones to pass the WHO’s guidelines
Air pollution is also associated with low birth weight, increased acute respiratory infections and stroke.
The WHO’s Air Quality Guideline value for PM2.5 exposure, which has been proven to be free of health impacts, is 10µg/m³ or 10 micrograms of air pollutant per cubic meter of air.
There are only 12 countries or territories, out of the 138 assessed, which pass these guidelines.
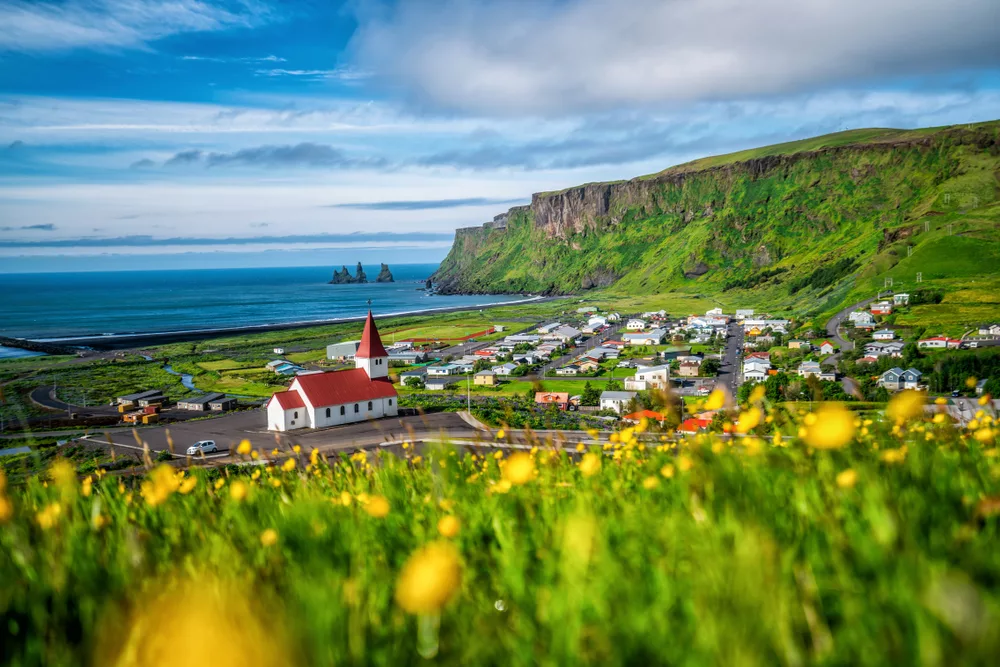 Blue Planet Studio/Shutterstock Iceland has the cleanest air in Europe
most polluted cities
The report also produces a ranking for thousands of the world’s cities. New Delhi famously hit the headlines in 2020 when the city witnessed drastically improved air quality when restrictions were introduced due to the pandemic.
However, the city soon returned to “normal” when pollution hit “emergency” levels in November 2020, and the city became enveloped in thick, toxic smog.
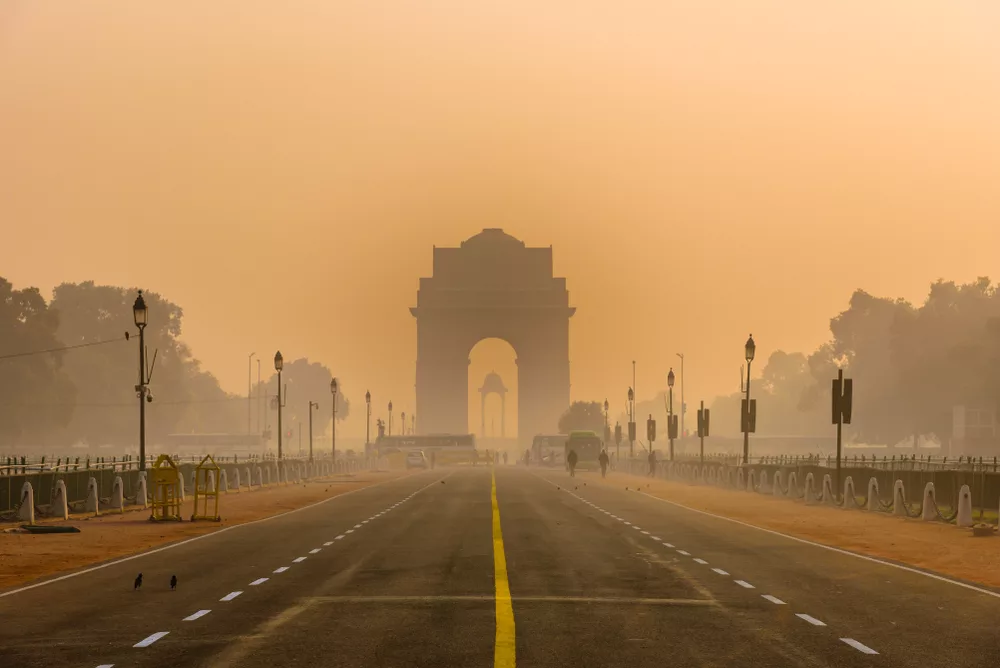 Amit kg/Shutterstock Delhi is the world’s most polluted capital city
Bangladesh, China, India, and Pakistan share 47 of the 50 most polluted cities worldwide, with six of the 10 most polluted in India alone. Byrnihat in India is the world’s most polluted city, while New Delhi is the world’s most polluted capital.
Most polluted cities
- Byrnihat, India
- Delhi, India
- Karaganda, Kazakhstan
- Mullanpur, India
- Lahore, Pakistan
- Faridabad, India
- Dera Ismail Khan, Pakistan
- N’Djamena, Chad
- Loni, India
- New Delhi, India
Most polluted capital cities
- New Delhi, India
- N’Djamena, Chad
- Dhaka, Bangladesh
- Kinshasa, D R Congo
- Islamabad, Pakistan
- Dushanbe, Tajikistan
- Hanoi, Vietnam
- Kathmandu, Nepal
- Abuja, Nigeria
- Jakarta, Indonesia
COUNTRY RANKING: Cleanest air in the world
The World Air Quality Report ranks 138 countries and territories from the most polluted to the least. States that have been omitted lack sufficient ground-based PM2.5 monitoring stations.
| 1 | Bahamas | 2.3 |
| 2 | Bermuda | 2.5 |
| 3 | French Polynesia | 2.5 |
| 4 | US Virgin Islands | 2.6 |
| 5 | Puerto Rico | 2.7 |
| 6 | Montserrat | 2.7 |
| 7 | Barbados | 3.1 |
| 8 | Grenada | 3.2 |
| 9 | Iceland | 4.0 |
| 10 | New Zealand | 4.4 |
| 11 | Australia | 4.5 |
| 12 | Estonia | 4.6 |
| 13 | Finland | 5.2 |
| 14 | Sweden | 5.3 |
| 15 | Andorra | 6.0 |
| 16 | Trinidad & Tobago | 6.1 |
| 17 | Ireland | 6.5 |
| 18 | Liechtenstein | 6.5 |
| 19 | Norway | 6.6 |
| 20 | Canada | 6.7 |
| 21 | Portugal | 6.8 |
| 22 | Costa Rica | 7.0 |
| 23 | USA | 7.1 |
| 24 | Denmark | 7.2 |
| 25 | Switzerland | 7.3 |
 CHEN MIN CHUN/Shutterstock Switzerland is ranked 25th
| 26 | UK | 7.4 |
| 27 | Anguilla | 7.4 |
| 28 | Luxembourg | 7.5 |
| 29 | France | 8.1 |
| 30 | Cayman Islands | 8.5 |
| 31 | Japan | 8.6 |
| 32 | Spain | 8.7 |
| 33 | Argentina | 8.7 |
| 34 | Belgium | 8.9 |
| 35 | Netherlands | 8.9 |
| 36 | Germany | 9.0 |
| 37 | Latvia | 9.2 |
| 38 | Ukraine | 9.2 |
| 39 | Ecuador | 9.7 |
| 40 | Russia | 9.8 |
| 41 | Bolivia | 10.0 |
| 42 | Panama | 10.1 |
| 43 | Lithuania | 10.1 |
| 44 | Austria | 10.2 |
| 45 | Singapore | 11.4 |
| 46 | Uruguay | 11.5 |
| 47 | Greece | 11.5 |
| 48 | Malta | 11.7 |
| 49 | Maldives | 12.2 |
| 50 | Bulgaria | 12.4 |
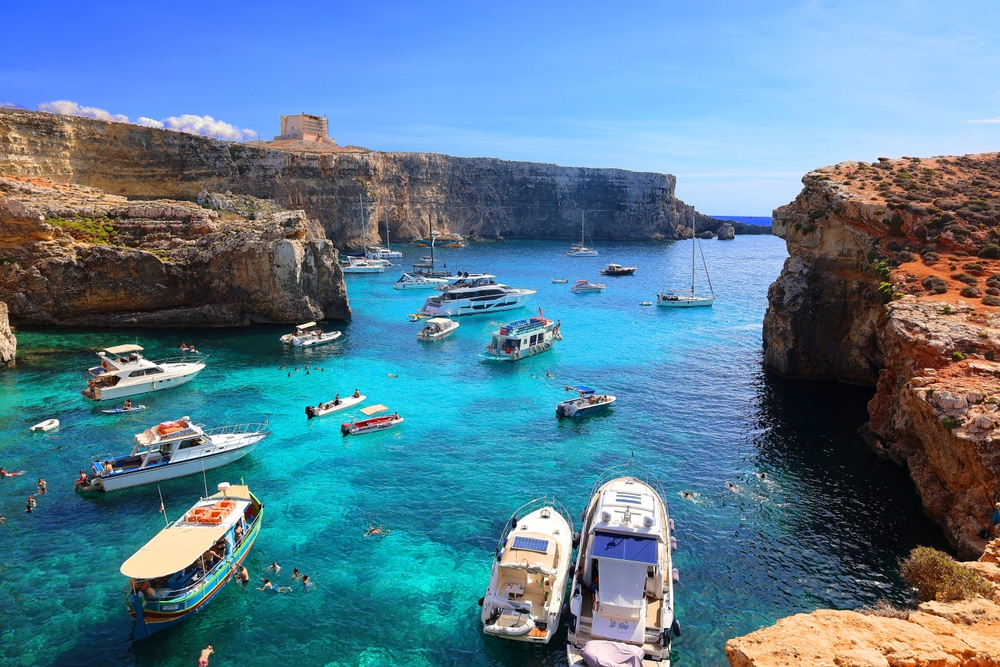 meunierd/Shutterstock Malta is ranked 48th
| 51 | Suriname | 12.5 |
| 52 | Czech Republic | 12.7 |
| 53 | Cyprus | 12.8 |
| 54 | Kosovo | 12.9 |
| 55 | Hungary | 12.9 |
| 56 | Slovakia | 13.6 |
| 57 | Colombia | 13.8 |
| 58 | Croatia | 13.8 |
| 59 | Italy | 14.2 |
| 60 | Kenya | 14.3 |
| 61 | Albania | 14.5 |
| 62 | Moldova | 14.7 |
| 63 | Nicaragua | 14.8 |
| 64 | Poland | 14.8 |
| 65 | Philippines | 14.8 |
| 66 | Brazil | 14.9 |
| 67 | Georgia | 15.1 |
| 68 | Kazakhstan | 15.1 |
| 69 | Gabon | 15.2 |
| 70 | Honduras | 15.2 |
| 71 | Slovenia | 15.2 |
| 72 | Turkey | 15.3 |
| 73 | Romania | 15.3 |
| 74 | Algeria | 15.4 |
| 75 | Paraguay | 15.9 |
 TRAVEL TAKE PHOTOS/Shutterstock South Korea is 80th
| 76 | Hong Kong SAR | 16.3 |
| 77 | Chile | 16.6 |
| 78 | Mozambique | 16.7 |
| 79 | Djibouti | 16.8 |
| 80 | South Korea | 17.0 |
| 81 | Peru | 17.1 |
| 82 | Israel | 17.2 |
| 83 | El Salvador | 17.3 |
| 84 | Mexico | 17.4 |
| 85 | Taiwan | 17.5 |
| 86 | Guyana | 17.5 |
| 87 | Macao SAR | 17.7 |
| 88 | Sri Lanka | 17.9 |
| 89 | Montenegro | 18.0 |
| 90 | Azerbaijan | 18.3 |
| 91 | Malaysia | 18.3 |
| 92 | South Africa | 18.8 |
| 93 | Guatemala | 18.8 |
| 94 | Thailand | 19.8 |
| 95 | Serbia | 20.2 |
| 96 | Madagascar | 20.5 |
| 97 | Palestine | 21.1 |
| 98 | Kyrgyzstan | 21.1 |
| 99 | Cambodia | 21.9 |
| 100 | Zambia | 22.0 |
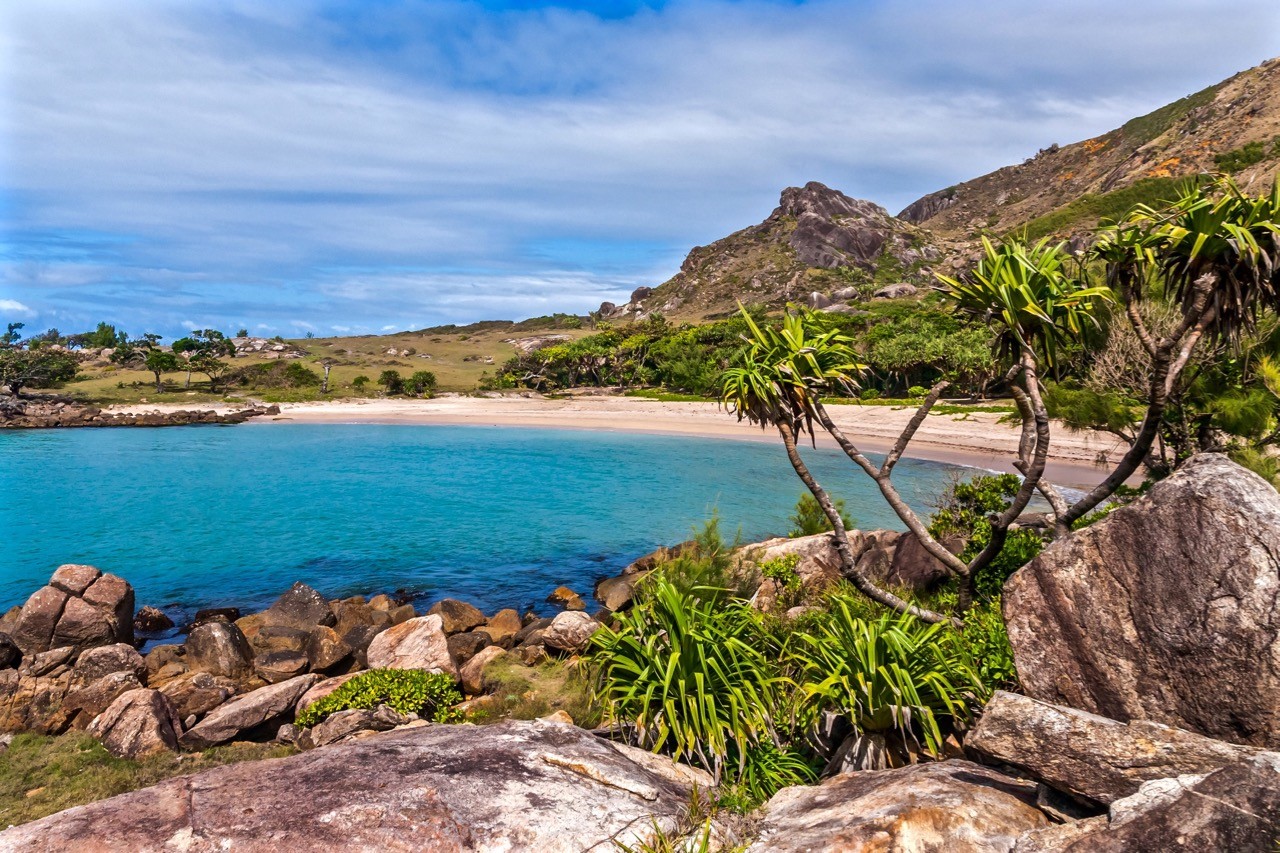 Dreamstime Madagascar is ranked 96th
| 101 | Ethiopia | 22.2 |
| 102 | Senegal | 22.3 |
| 103 | Libya | 22.3 |
| 104 | North Macedonia | 23.3 |
| 105 | Armenia | 24.4 |
| 106 | Ivory Coast | 24.6 |
| 107 | Zimbabwe | 24.8 |
| 108 | Saudi Arabia | 25.1 |
| 109 | Myanmar | 25.2 |
| 110 | Bosnia Herzegovina | 25.3 |
| 111 | Mongolia | 25.6 |
| 112 | Togo | 26.0 |
| 113 | Turkmenistan | 26.5 |
| 114 | Laos | 27.5 |
| 115 | Cameroon | 27.6 |
| 116 | Vietnam | 28.7 |
| 117 | Kuwait | 30.2 |
| 118 | China | 31.0 |
| 119 | Qatar | 31.3 |
| 120 | Uzbekistan | 31.4 |
| 121 | Bahrain | 31.8 |
| 122 | UAE | 33.7 |
| 123 | Gambia | 35.2 |
| 124 | Indonesia | 35.5 |
| 125 | Ghana | 35.8 |
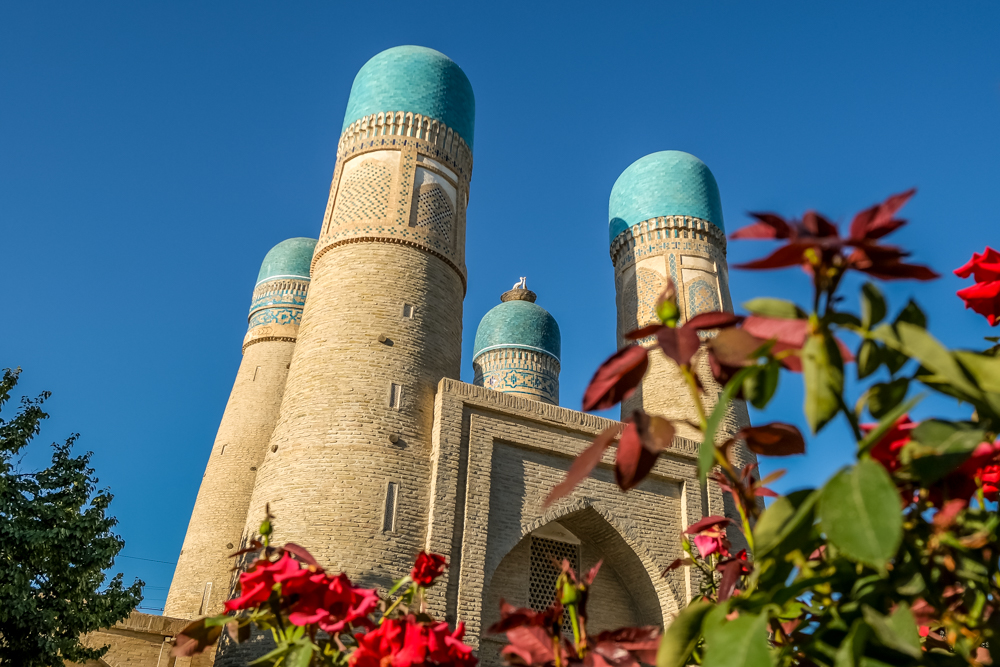 Atlas & Boots Uzbekistan is 120th
| 126 | Iraq | 38.4 |
| 127 | Egypt | 39.8 |
| 128 | Nigeria | 40.1 |
| 129 | Burundi | 40.3 |
| 130 | Rwanda | 40.8 |
| 131 | Uganda | 41.0 |
| 132 | Nepal | 42.8 |
| 133 | Tajikistan | 46.3 |
| 134 | India | 50.6 |
| 135 | DR Congo | 58.2 |
| 136 | Pakistan | 73.7 |
| 137 | Bangladesh | 78.0 |
| 138 | Chad | 91.8 |
Enjoyed this post? pin it for later…


 English (US) ·